by Chris | Jul 7, 2022 | GeoConquesting, Geofencing, Google Analytics
Traffic Oxygen’s attribution reporting tool is useful for measuring campaign performance and foot traffic from a target audience that you are marketing to against a destination – the location or set of locations you were driving them to visit during the campaign period. You can measure visitors to a website or landing page using Traffic Oxygen’s or your own pixel and include them in your attribution reports. But did you know that you can run attribution reporting at any time and that there are some valuable reasons for doing so? Here are alternative ways you can use the attribution reporting tool and why:
Pre-campaign Analytics and Research
Compare your target audiences built with the demographic selector, web pixel (including IP address upload), or residential address upload against the current foot traffic to your destination(s) pre-campaign. Additionally, analyze the demographic makeup of current responders to provide insights into how to tailor your offer, or reveal a customer persona you should be pursuing instead. This analysis can allow you to make proactive adjustments to your target audience in order to make your campaign even more effective. Build a post-campaign attribution report and compare the lift in foot traffic that your marketing efforts created!
Audience Filtering
Have you ever wondered how best to create an audience that combines two different audience types? Attribution reporting allows you to filter your audience in a multitude of ways to get even more precise targeting. Below are a few examples:
- Demographics vs. in-store visitors (example: how many women aged 35-50 with children shop at competitor stores?)
- In-store shoppers vs. Trade Area households (example: how many loyal customers live in the local area?)
- Website visitors vs. in-store visitors (example: how many digital visitors also show up in-person? Do they have different demographics or live in different areas?)
- Create targets from shoppers that shop at your store and competitor location(s)
- Filter current in-store/web customers out of your target audience
Overlap Analysis
Create a customer persona based on an analysis of the locations that they frequently visit. For example, your target audience includes avid outdoor enthusiasts. People in this persona are likely to visit locations such as hiking trailheads, ski resorts, or climbing gyms. Running an attribution report to identify a group of devices that visit more than one of these locations can help you pinpoint your outdoor enthusiast audience even further.
During Campaign Performance
We have made running more frequent attribution reports easier with our weekly scheduling tool. This allows you to run reports on an automated basis to understand performance during your campaign. See foot traffic trends before the campaign is over, allowing you to make adjustments to your offer, creative, landing page, optimizations in the DSP, etc.
Digital Customer Journey via Web Pixel
Use a web pixel audience as either a target or destination audience in an attribution report to understand the full customer journey from both an in-person and digital perspective. Using Traffic Oxygen’s web pixel onto your site and creating pixel audiences will help you segment your customers into digital-only, in-store only, or a hybrid of the two which can further help you tailor offers to these customers based on their behavior and where they prefer to shop.
Responder Audiences
Audience filtering can be utilized via a responder audience to enhance your original target and can be published to your DSP or social media network similar to other audience types. Utilize our audience extension capabilities to further increase your reach and scale to known visitors to your destination(s).
As you can see, there are many different options for running attribution reports other than after a campaign has been completed. Contact our team today to learn more about this tool and other audience-building functions within the platform.

by Traffic Oxygen | Jan 12, 2019 | FAQs, Google Analytics
Google Analytics has cleaned up ghost spam quite a bit since the outbreak between 2015-2017. However, those spammers that do break through still lure unsuspecting targets to click on dangerous websites and in the very least, cause much confusing when reviewing analytics. Clearly it’s still working or these trolls would be out of business.
If you are most concerned about multiple clicks from odd locations and worry it’s eating up your ad spend, check out our quick quide on Weird Analytics Traffic.
Before we go into setting up a filter for your analytics account so you are only viewing the relevant website traffic you care about most, let me caution you to avoid the following tragic errors that could put your website at risk:
Never visit the suspicious URL. Most of the time they’ll try to sell you something or promote their service, but some spammers might have some malicious scripts on their site.
Never install scripts from unknown sites. If you have already done so, remove it immediately and scan your site for malware.
High traffic numbers not making sense.
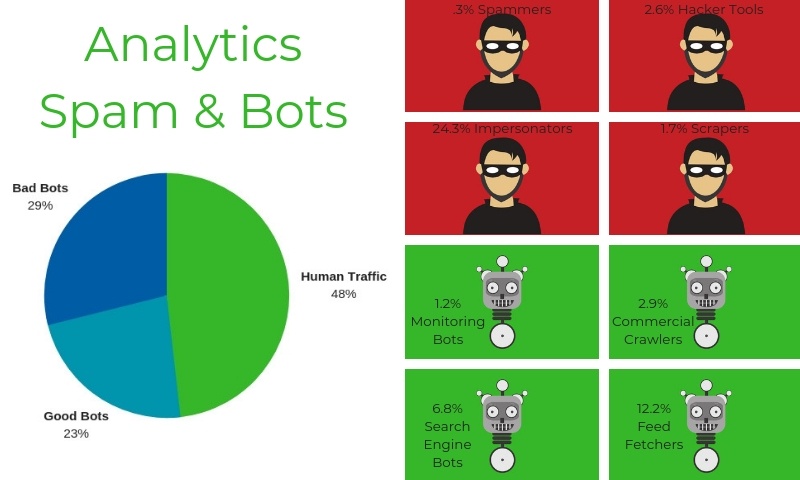
A bot is a software bit that runs automated scripts over the internet for different purposes. There are many types, but we’ll call them “good” (checking for copyright infringement, indexing your website for search engines) and “bad” (scraping your content prior to it being indexed).

Since you likely have limited availability to completely nix these bad bots, you do have the power to not have their presence mess with your reports by using Google Analytics filters.
Analytics Filtering First Steps:
1. Create an unfiltered view.
Best practices for Google Analytics advises you create/keep an unfiltered view. Not only will you be able to monitor the efficacy of your filters, but it will be your backup in case something goes wrong.
2. You Need Google Analytics Editing Permissions.
You will need edit permissions at the account level to create filters; edit permissions at view or property level won’t work.
3. Filters Don’t Work Retroactively.
Google Analytics aggregated historical data can’t be deleted. You will be unable to apply the filter to historical reports.
4. The changes made by filters are permanent!
If your filter is not correctly configured because you didn’t enter the correct expression (missing relevant entries, a typo, an extra space, etc.), you run the risk of losing valuable data FOREVER; there is no way of recovering filtered data. This is why we advise you have an unfiltered view to pull all of your data from in the event you have to scrap any mistakes and still get the information you need.
Analytics Filtering Types
There are two main types of filters: predefined and custom.
Predefined filters are very limited and not always what’s most relevant to me. Custom filters allow regular expressions, which makes them a lot more flexible. These are your reports, afterall, so don’t be afraid to make them yours!
Within the custom filters, there are five types: exclude, include, lowercase/uppercase, search and replace, and advanced. We are only going to go over the most relevant to your viewing accurate traffic from your organic and advertising efforts.
Google has already done an amazing job at providing as much in-depth information with screen shots to guide you. Why reinvent the wheel when you can learn from the Masters themselves? Here are the basic steps if you are in a pinch and are relatively comfortable using Google Analytics, but should you require more guidance, you’ll want to check out Googles Filter guide.
 Create a Filter at the Account Level*
- Sign in to Google Analytics..
- Click Admin, and navigate to the account in which you want to create the filter. (If you don’t manage multiple accounts as a Google Partner or Agency, you’ll already be in the account you want to filter if is your only website/account.)
- In the ACCOUNT column, click All Filters.
- Click + New Filter. (If this button is not visible, you do not have the necessary permission.)
- Select Create new Filter.
- Enter a name for the filter.
- Select Predefined filter to select from the predefined filter types.
- Select Custom filter to construct a custom filter from the options we provide. If you create a custom filter, consult our definitions of the filter fields.
- From the Available views list, select the views to which you want to apply the filter, then click Add.
- Click Save.
By default, view filters are applied to the data in the order in which the filters were added. So, if there are existing filters for a view, your new filter is applied after them.
 Create a Filter at the View Level*
- Sign in to Google Analytics..
- Click Admin, and navigate to the view in which you want to create the filter.
- In the VIEW column, click Filters.
- Click + New Filter. (If this button is not visible, you do not have the necessary permission.)
- Select Create new Filter.
- Enter a name for the filter.
- Select Predefined filter to select from the predefined filter types.
- Select Custom filter to construct a custom filter from the options we provide. If you create a custom filter, consult our definitions of the filter fields.
- From the Available views list, select the views to which you want to apply the filter, then click Add.
- Click Save.
Applied Google Analytics Filters and Still Confusing Traffic?
If after applying your Google Analytics Filters you still see confusing or contradicting numbers, please reach out to your Account Manager through Intercom. They will be happy to look through our very detailed reporting to ensure there are no errors effecting your ad spend and results.
*Detailed steps curtosy of Googles Filter guide.

by Traffic Oxygen | Jan 12, 2019 | FAQs, Google Analytics
Analytics traffic from odd locations confusing your reports? Let me first assure you, your ad spend is not being thrown into geographic locations that you have not specifically asked for.
Now that we have that out of the way, let’s go over what you’re seeing.
Phoenix, India and Canada, Oh MY!
1 Many of our Account Managers are located in the Phoenix, AZ area. As part of your DFY account, we’ll pop into your landing pages from time to time for testing and analysis. You’ll likely see a couple dozen clicks from us when we first set up our systems for you to start your campaigns and quite a few each month as we drill down your metrics.
2 We have servers are in Canada. So although I’d love your brand to go international, you’re like seeing our systems doing their magic as we test the continuing functionality of your landing pages.
3. One of our Developer Rock Stars is located in India. When we notice any technical issues, we call on him to resolve them before any damage is done. He’ll pop in and out of landing pages as he tests anything he reworks.
Analytics Traffic, Friend or Foe?
4. Your analytics are not fabulous. Many hosting platforms (WordPress, Weebly, etc.) provide their own built in analytics but let’s go over the difference between site traffic and real users and potential customers that have come to your website to consume your message.
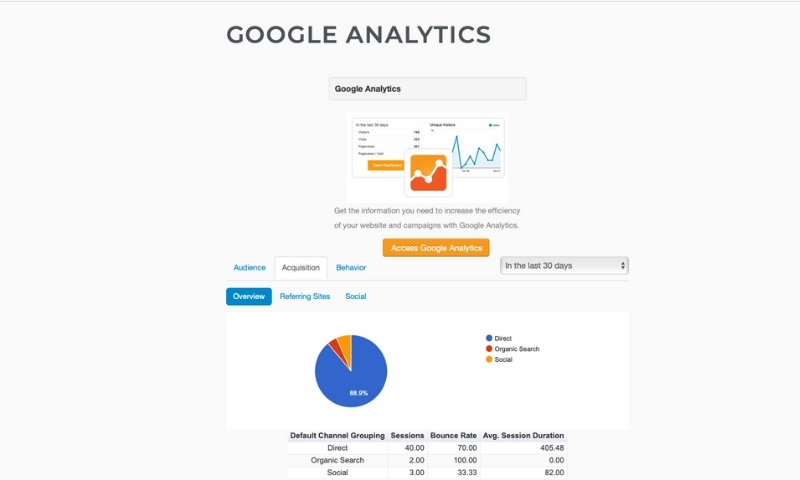
Have a look at the bare bones version of traffic insight offered on this WordPress site. Pretty lack-luster, right?

You are not getting any insightful information from this type of Google Analytics Traffic. Can we even call this an analytics traffic report? What you see above certainly will not help you drill down your audience, analyze what’s working or where you can dial down those things that are not working. You want to know where you can earn more quality traffic and not waste resources. We suggest adding Google Analytics Filters so you can remove the annoying bot and spam traffic from your Analytics reports.
Platform dashboard “analytics” will often give you a snapshot oftraffic. And justtraffic. All of it… and it’s, well, it’s weird. This traffic will include bots, crawls and all of the spammy tricks that unscrupulous service providers will use to get your attention.
Bots, Spam and Other Other Trolls
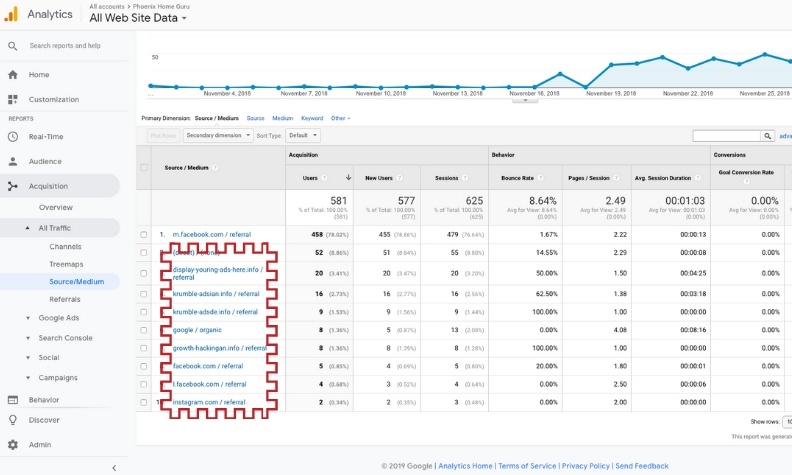
See below… these are click-bait providers from raw, unfiltered Analytics.

I’ve seen them even more aggressive where they spam you with hundreds of clicks to get you excited, only to realize that it’s coming from “Get More Likes” out of Russia. This is an example of an unfiltered analytics account. It’s not pretty.
When you get your analytics filters set up appropriately, you’ll only see the traffic that’s important to you.
5. We stand behind our data and protect your ad spend. Period. When considering a CPM (cost per 1,000 impressions) of less than $10, you’d be hard pressed to care about the twenty odd impressions coming from odd locations, but rest assured. If you need to talk a client down from the ledge because they fear that you are burning through their cash, please share these insights. If you want to avoid the conversation in the first place, set up your Google Analytics Filters prior to running your Traffic Oxygen campaigns. If you still can’t talk them down, reach out on intercom for a more detailed report on hourly or daily traffic. We can show you exactly where it’s coming from and when. We’ve got your back.


